The University of Michigan undergraduate admission grids
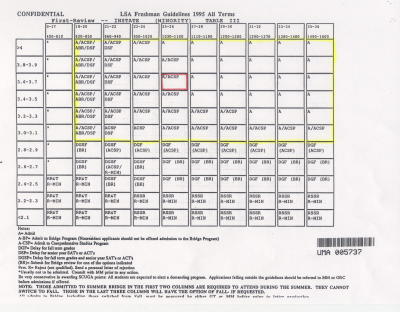
Below are links to grids used by the University of Michigan until 1995 to determine undergraduate admission based on race. Ranges of ACT and SAT scores form the columns of each chart and ranges of GPAs form the rows of each chart. The letter code in each cell of the grid determines whether an applicant is admitted, wait-listed or rejected. For instance, any code beginning with “A” means an applicant is automatically admitted by a clerk. Any letter beginning with a lower case “a” is passed to a counselor for decision as opposed to an automatic decision made by a clerk.
In the grid below, applicants falling within the area outlined in yellow were guaranteed admission. (Click on the grid below to display a larger version in a separate window.)
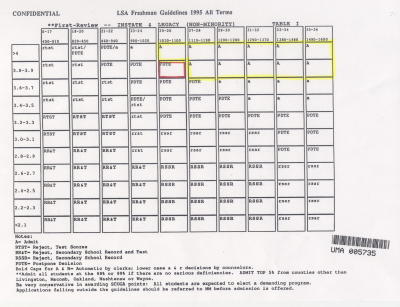
Jennifer Gratz’ GPA and ACT score placed her in the cell outlined in red, which is well within the yellow zone. Unfortunately, the above chart was only used for minority applicants — African-Americans, Hispanics and Native Americans. The chart below was used to determine whether Jennifer would be accepted.
The area outlined in yellow shows the test scores and grades needed by white applicants to have the same excellent chances of admission as in the previous chart’s yellow area. The safety zone consists of just 11 cells, while the previous grid’s safety zone comprised 54 cells.
This time Jennifer’s grades and scores show a poor chance of admission; in as much as the cell she falls into requires a postponement of the decision. In Jennifer’s case it ended with a rejection.


